OVERVIEW
Dashboard is a pictorial representation of your custom reports, which gives a real-time snapshot of your ALM (Application Lifecycle Management) process key metrics. Using dashboards, you can easily visualize the patterns and trends in work items, defects, verification and validation, service center support calls and all pre-audit Medical Device ISO 13485, ISO 60601, IEC 62304 related data. For example, you can glance at the products that are developed with backlog over a period of time, compare the current test results with expected results, or find the most needed assistance customer.
In Orcanos ALM, the dashboard comprises of different types of two-dimensional and three-dimensional charts (Panels). These charts are built with Adobe Flash technology, which displays the data dynamically. The various types of charts are bar, pie, Grid or Google Map. The unique feature in Orcanos ALM is the Traceability Matrix, which can be used to visualize the full traceability of risk through the design mitigation and verification and validation stages in development lifecycle.
User can add multiple dashboards, and multiple panels on each dashboard. A panel can be a grid, chart, or any other widget that represents content
- Left pane – list of Dashboard (Public/Private/Shared)
- Right pane – Dashboard Panels
To add new Panel – Click on the Add button at the bottom right of the Page
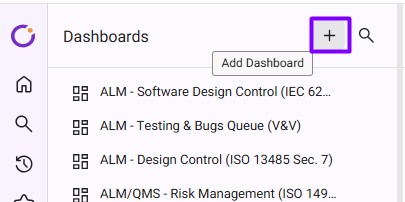
To add a Dashboard – Click on the “+” button on the left pane
